Step-by-Step Guide
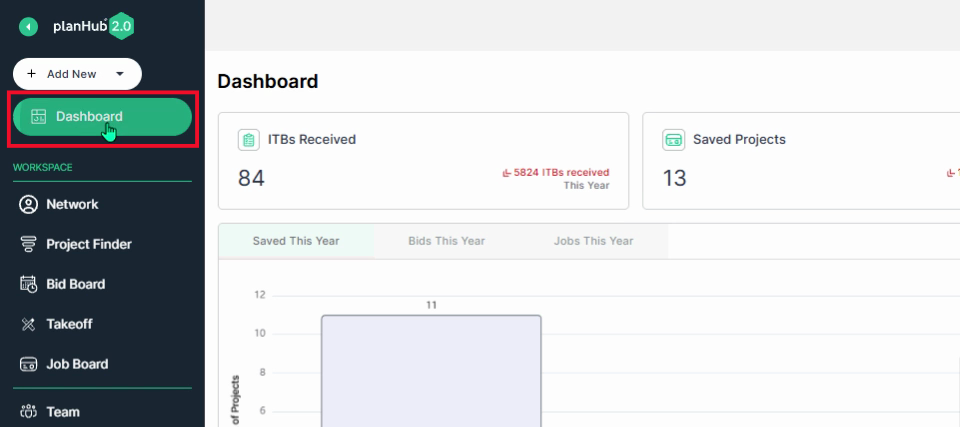
Step 1: Navigate to the Dashboard tab in the main panel.
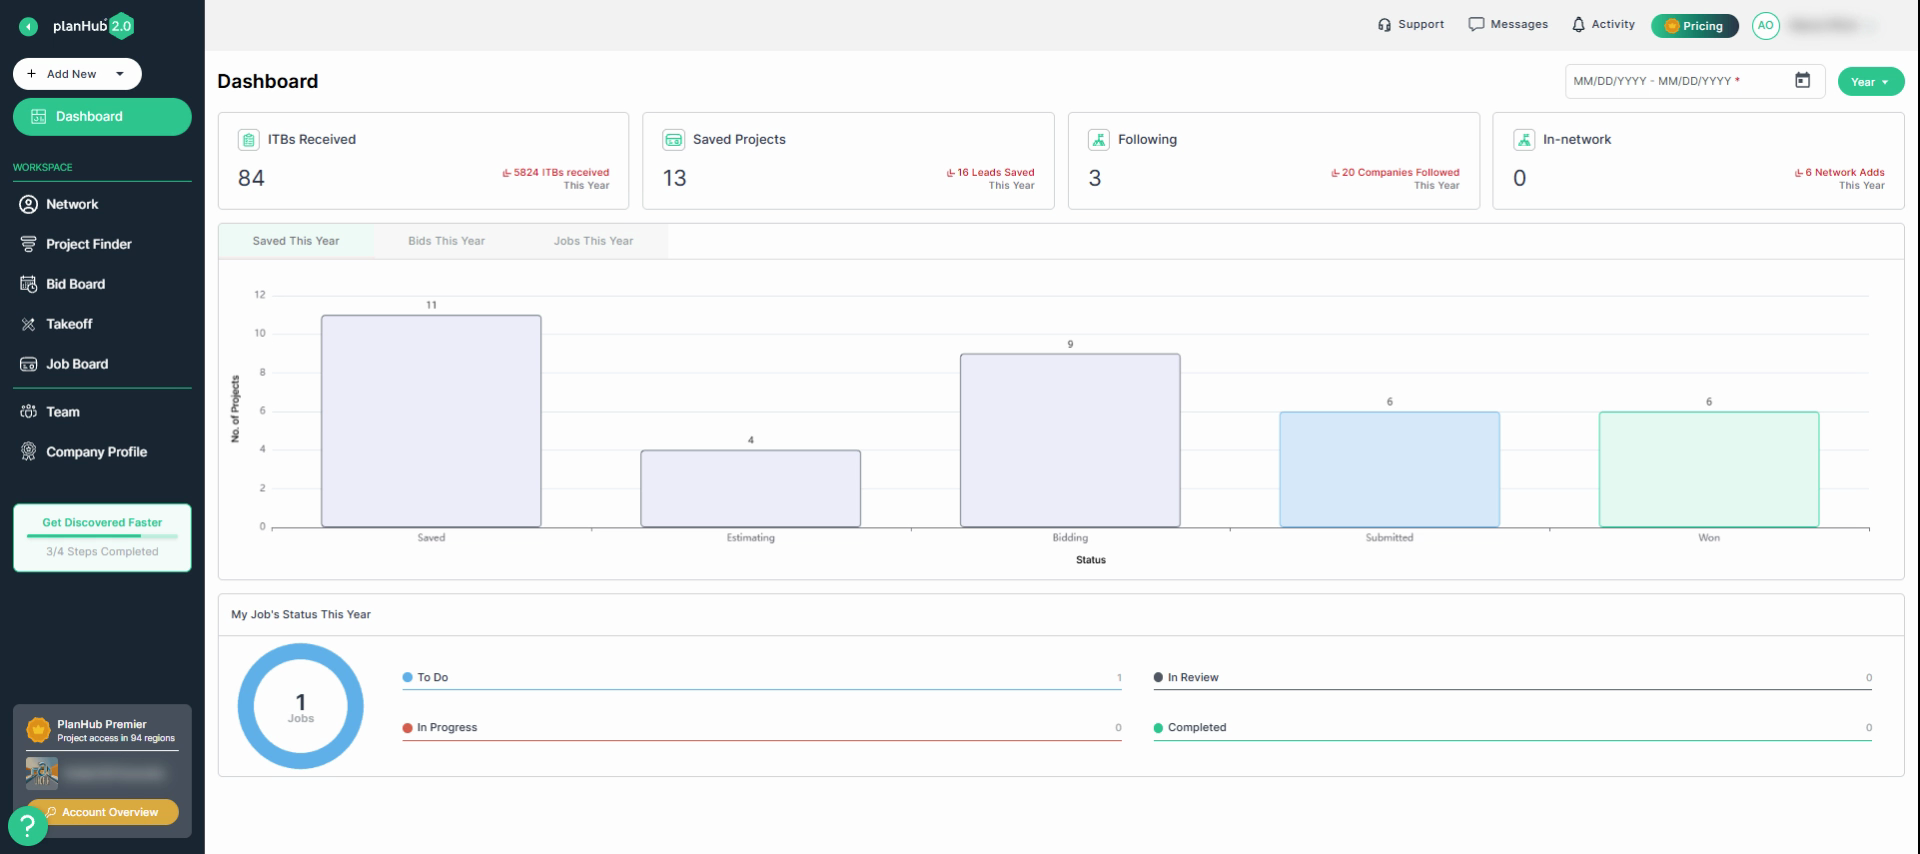
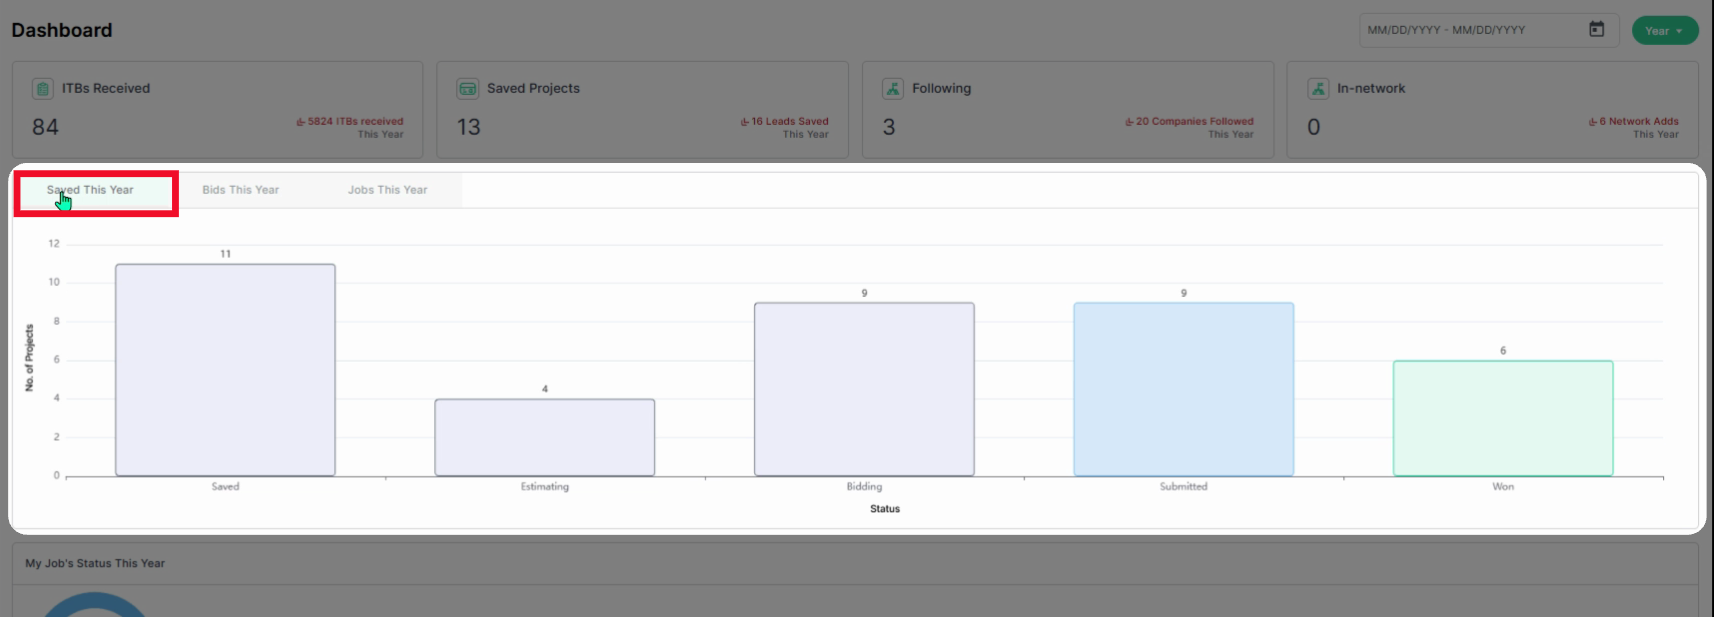
Step 2: View the summary of your team's performance, and overall activity in the dashboard.
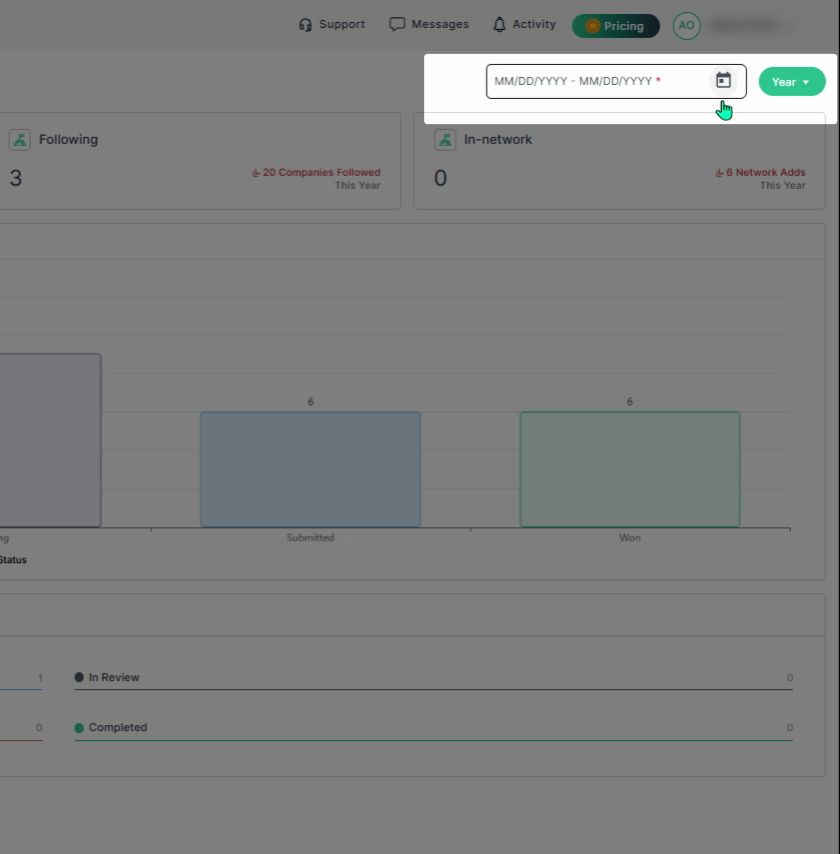
Step 3: Select a time frame by choosing a date range or an option from the dropdown menu in the upper-right corner to view results for the selected dates.
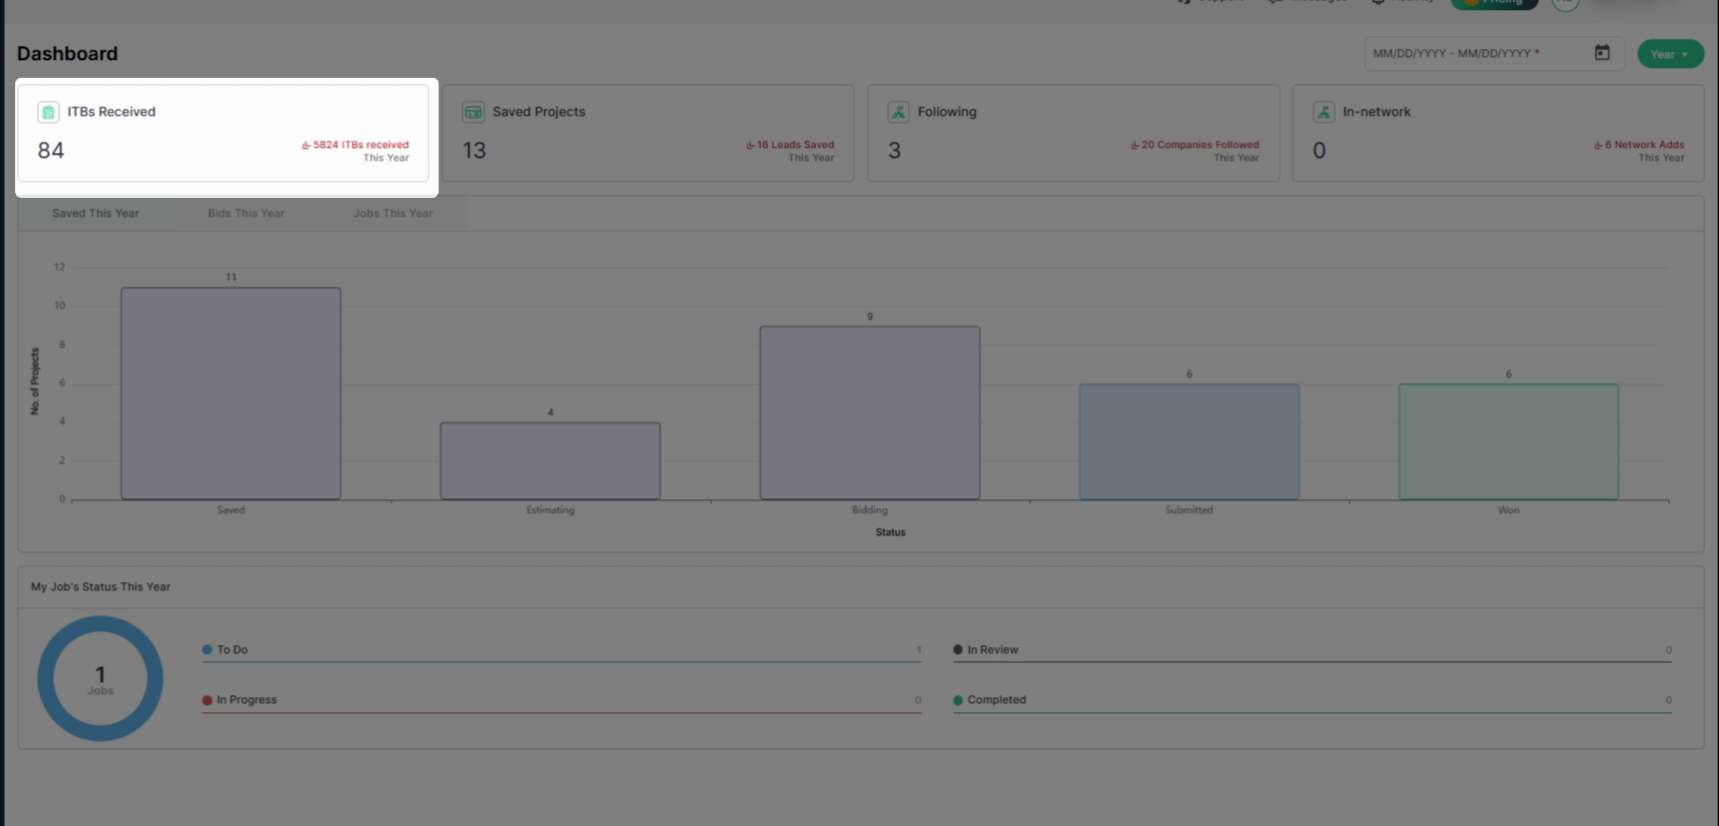
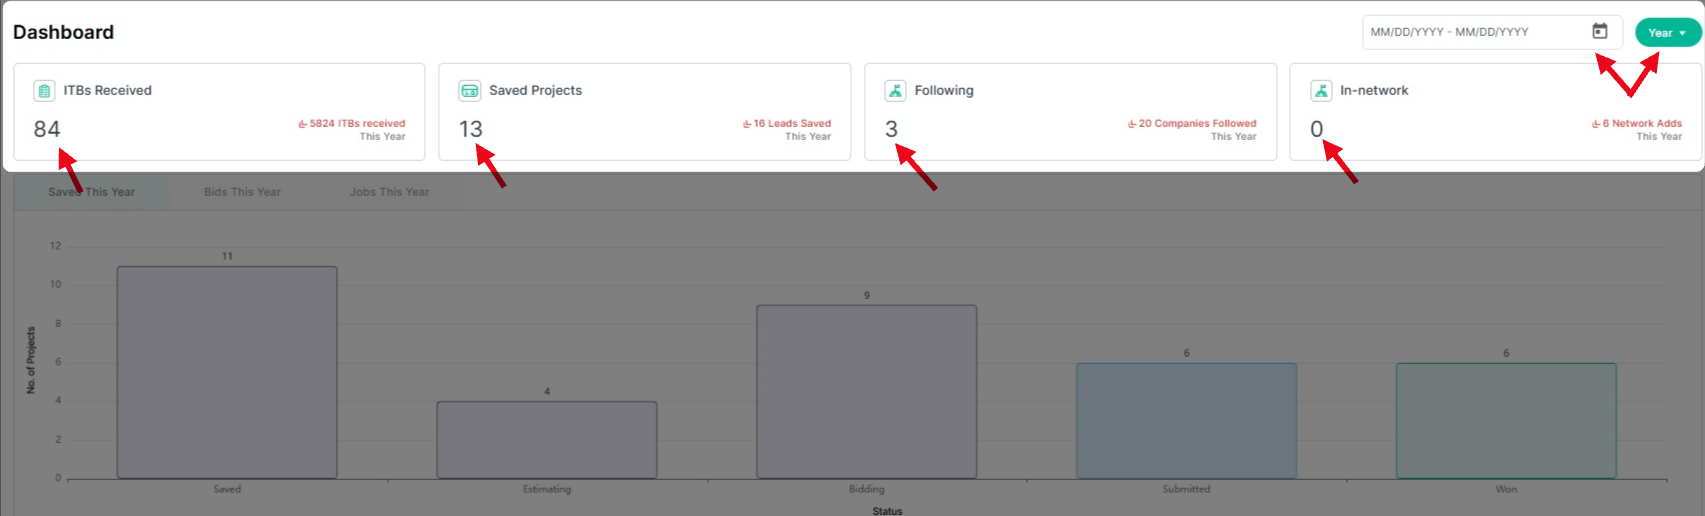
Step 4: On the left, view the ITBs Received to see how many invitations to bid your team has received. This metric tracks new bidding opportunities.
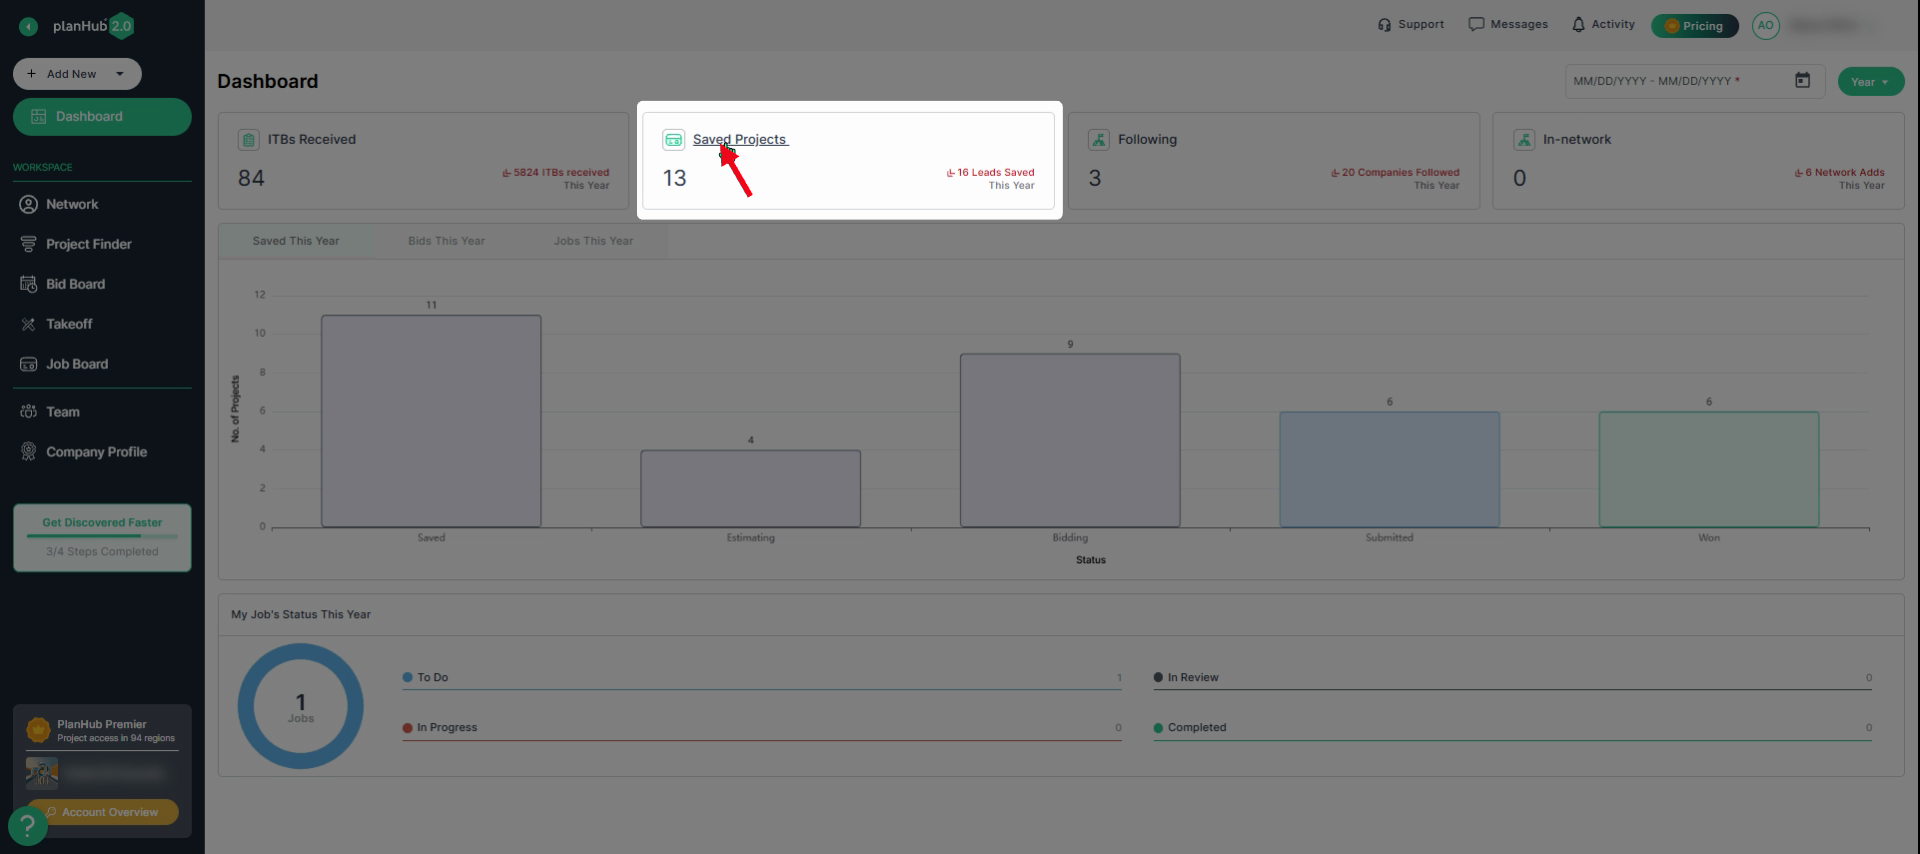
Step 5: View Saved Projects for a count of projects your team has saved to your Bid Board.
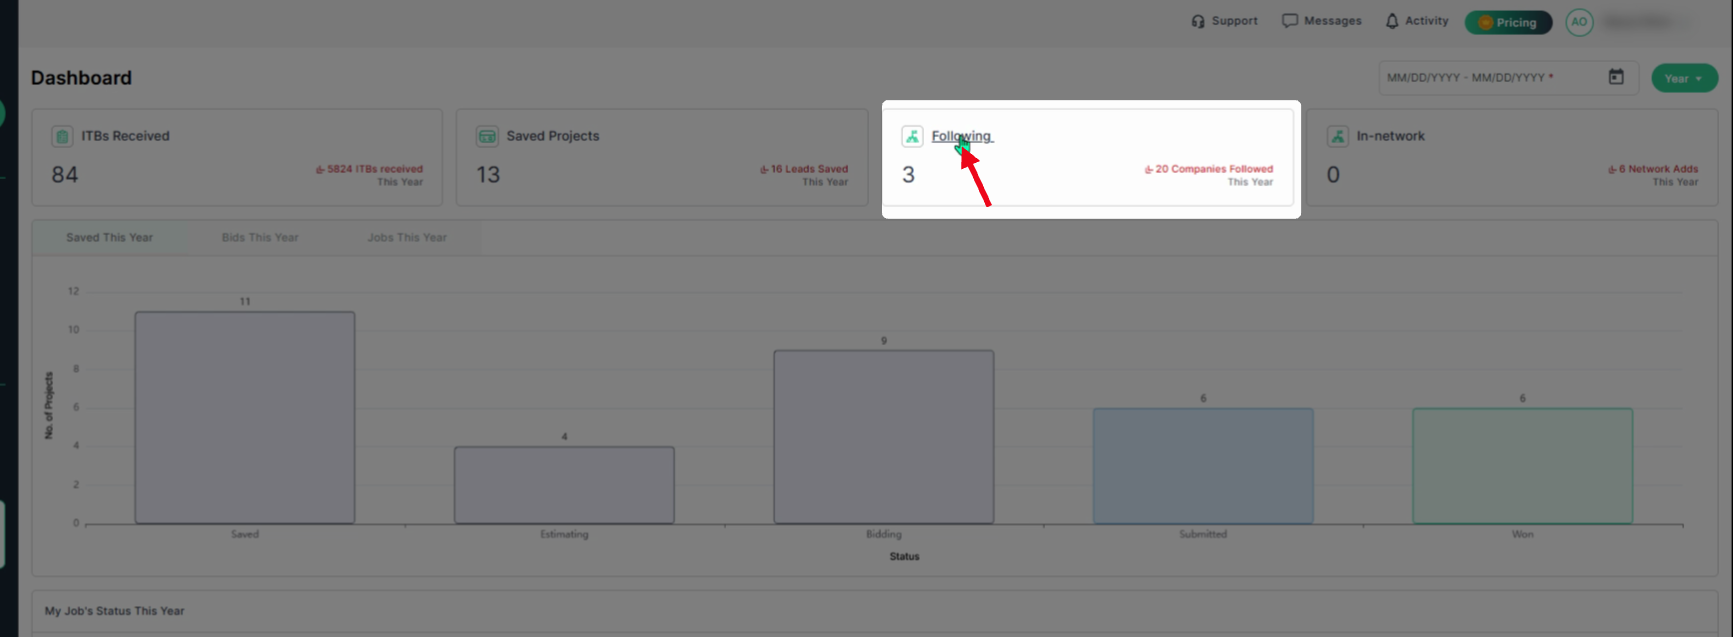
Step 6: View how many Companies you are Following. Click on Following to access your connections list and be redirected to the connections page in the Network section. To learn more about the Network add-on feature, refer to the Knowledge Base article: How-to Navigate the General Contractor Company Cards in the Network page for Subcontractors
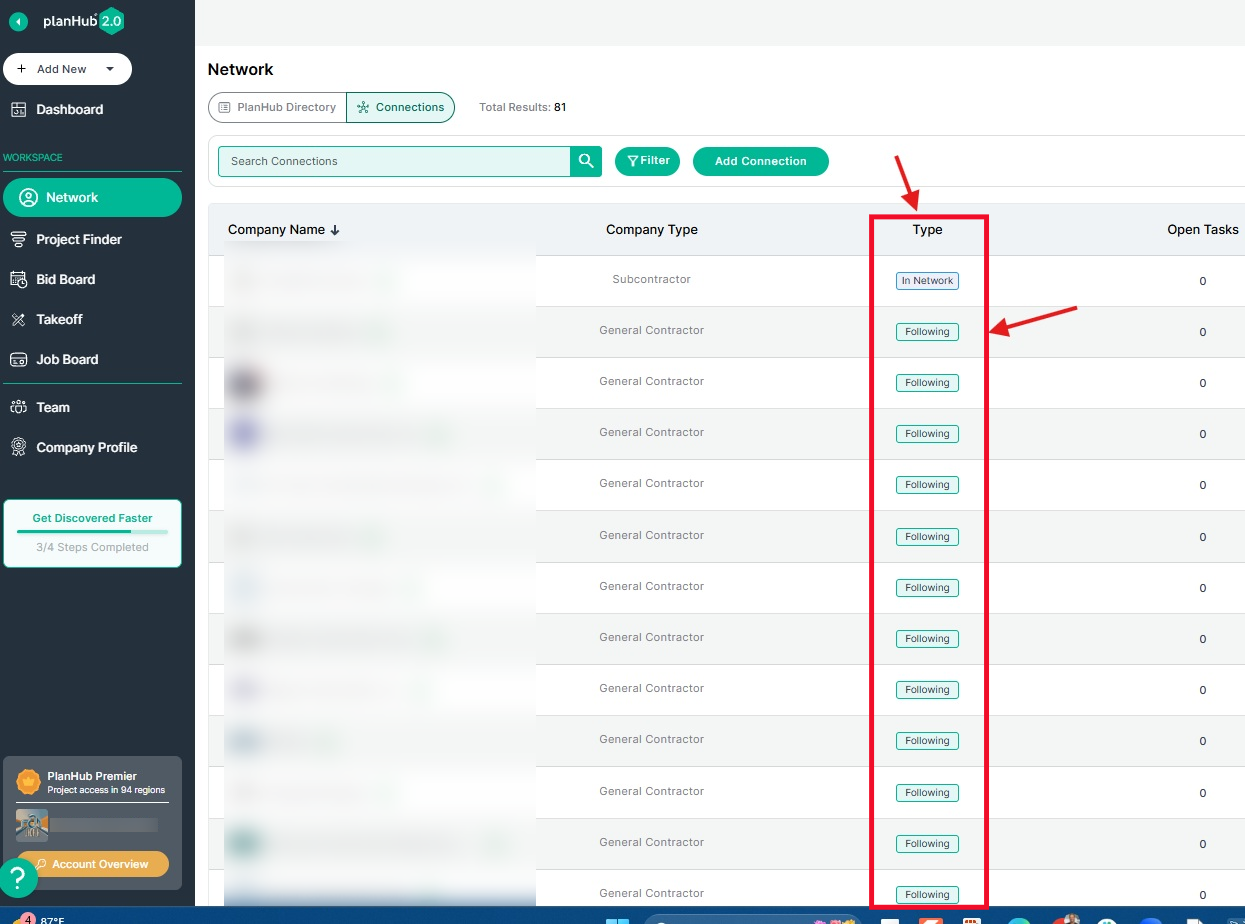
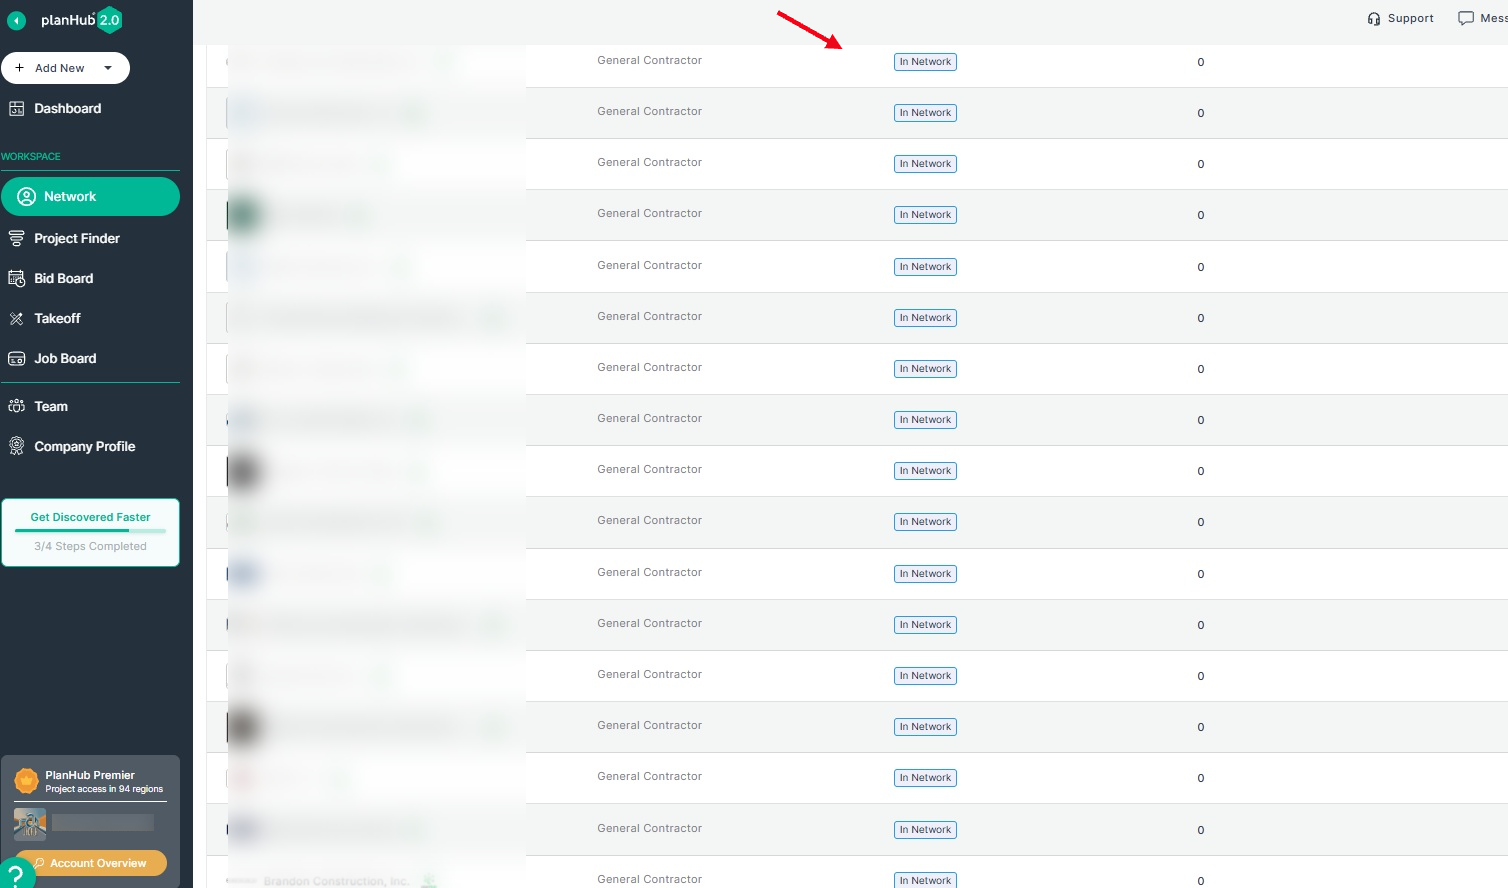
Step 7: In the In-Network section, you can see how many general contractors (GCs) have added your company to their private network. Select In-Network to be redirected to the Connections tab page in the Network and view the GCs who have added you.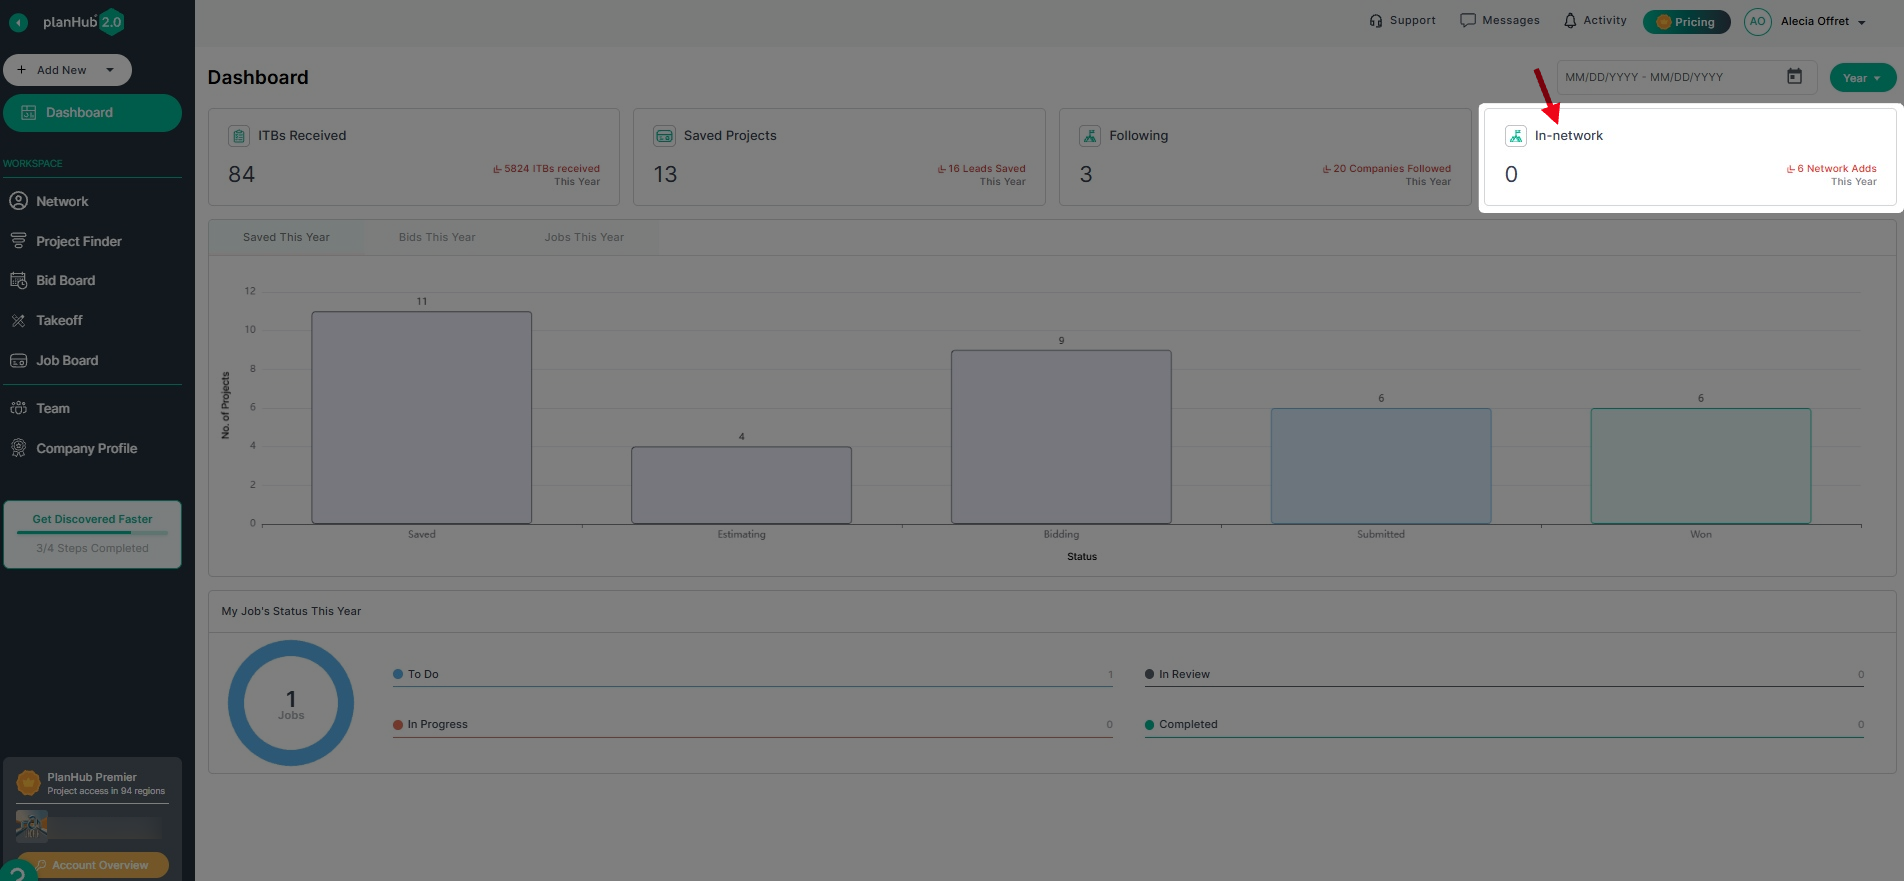
Step 8: The numbers displayed in each section reflect the selected date range. In this example, the year is selected.
Step 9: In the center panel, select a tab and view the graphs to track project activity.
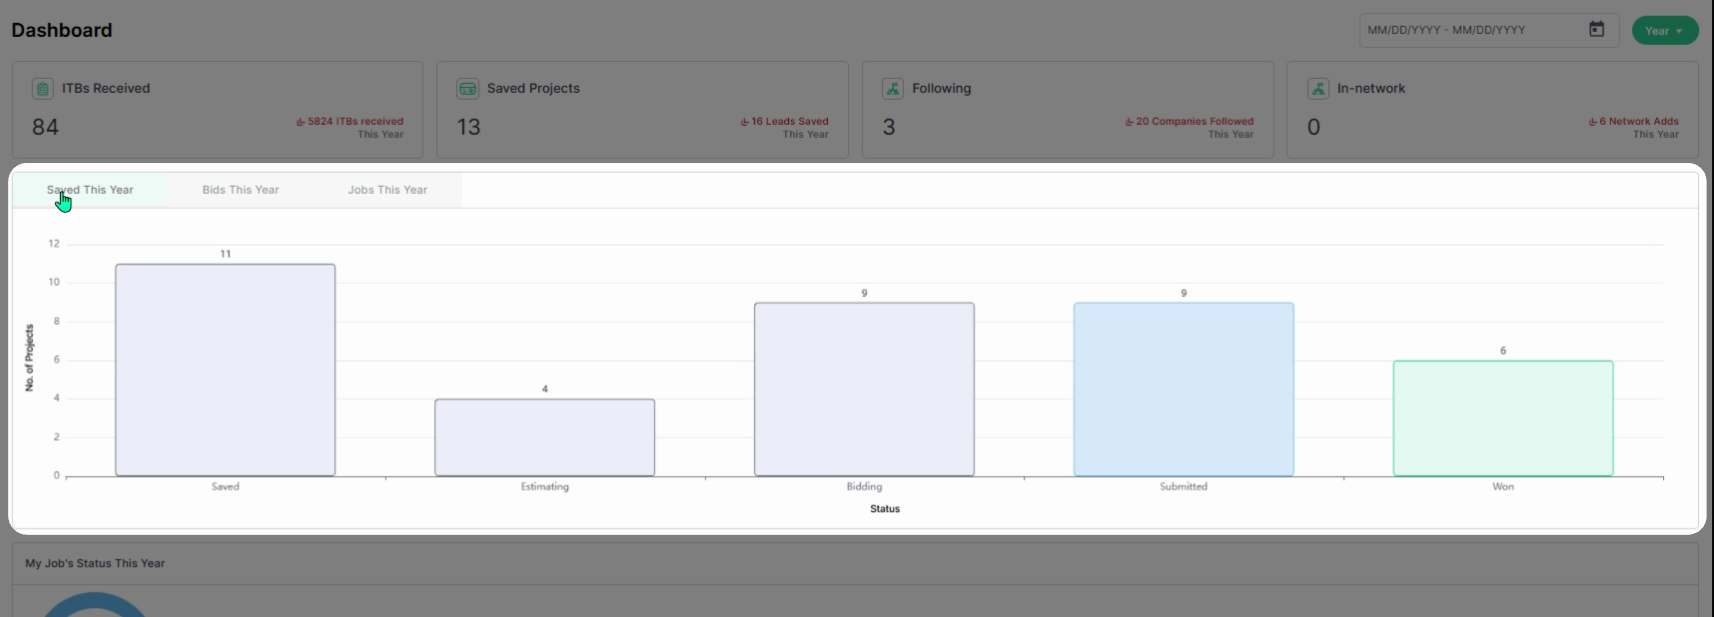
Step 10: Select a tab to view the details for each section based on the selected date range.
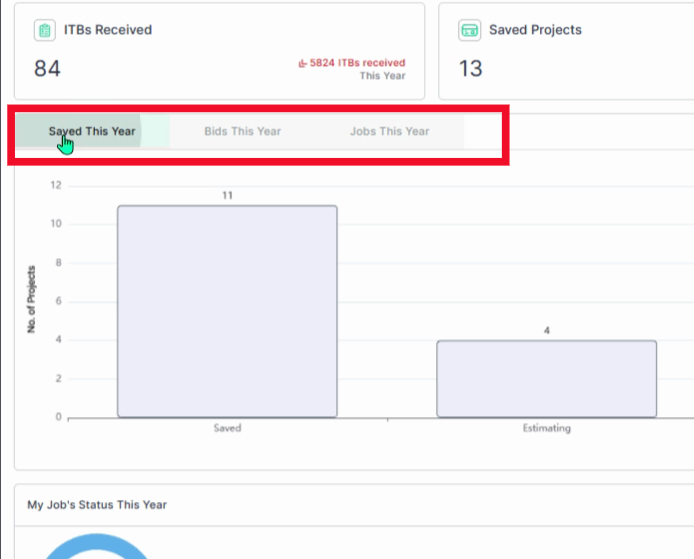
Step 11: Select the Saved tab to view the number of projects: Saved, in Estimating, Bidding, Submitted, or Won.
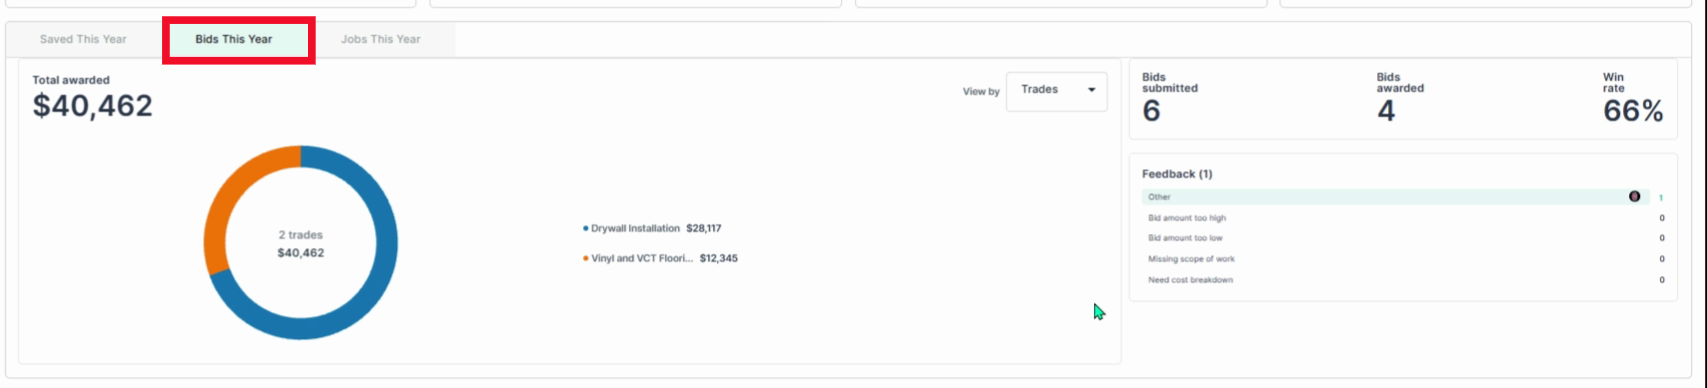
Step 12: Select the Bids tab to view the following: Total amount awarded, # of trades, trade types showing how the amount is distributed across each trade, and on the right side: the # of bids submitted, # of bids awarded, percentage of projects won, and Feedback received.
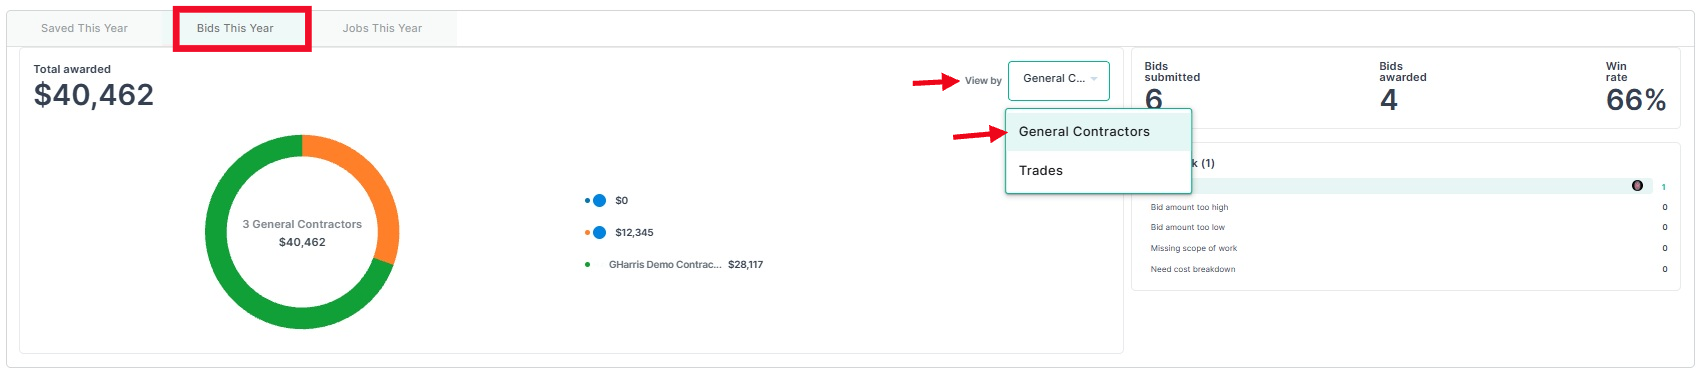
Step 13: Select the Bids tab then click on the "View by" dropdown menu to view information about the General Contractors as follows: The total amount awarded and how the value is distributed across the number of GCs. On the right side: the # of bids submitted, # of bids awarded, percentage of projects won, and Feedback received.
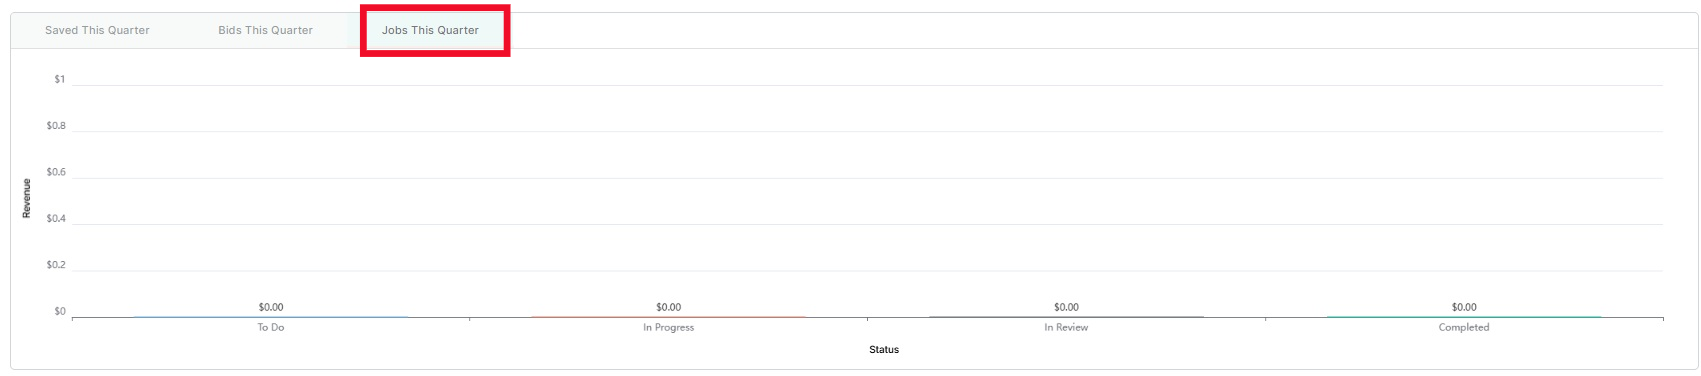
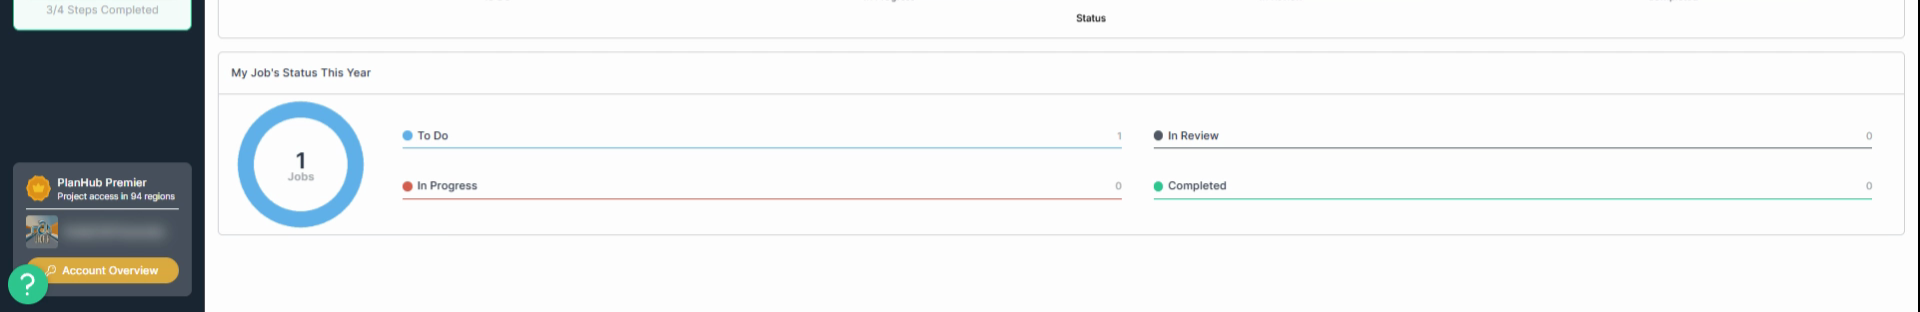
Step 14: Select the Jobs tab to review revenue and track each job’s status over the selected date range.
Step 15: If you have purchased the Job Board add-on feature, you can view the My Job’s Status section for a clear breakdown of job statuses within the selected date range. To learn more about the Job Board, refer to the Knowledge Base article: Job Board Overview | Navigation Guide To purchase the Job Board Add-On Feature, contact your Account Manager or Customer Support. To learn how to contact Customer Support, review the Knowledge Base article: How to Contact PlanHub Customer Support
The subcontractor Dashboard provides a centralized view of your key metrics, with filters for current or historical data and quick links for deeper insights which helps you stay organized, make informed decisions, and quickly access the information you need.